Reply With Quote
UESTION # 01
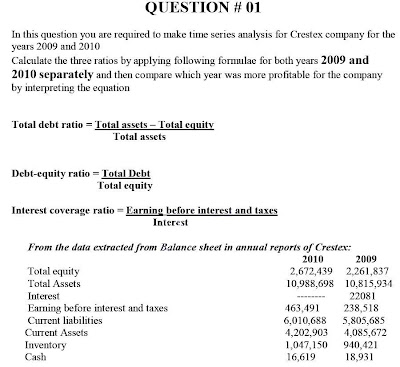
In this question you are required to make time series analysis for Crestex company for the years 2009 and 2010
Calculate the three ratios by applying following formulae for both years 2009 and 2010 separately and then compare which year was more profitable for the company by interpreting the equation
Total debt ratio = Total assets – Total equity / Total assets
Debt-equity ratio = Total Debt / Total equity
Interest coverage ratio = Earning before interest and taxes / Interest
From the data extracted from Balance sheet in annual reports of Crestex:
Total equity is (2010=2,672,439) (2009=2,261,837)
Total Assets are (2010=10,988,698 ) (2009=10,815,934)
Interest is (2010= ----) (2009= 22081)
Earning before interest and taxes (2010=463,491) (2009=238,518 )
Current liabilities (2010=6,010,688 ) (2009=5,805,685)
Current Assets (2010=4,202,903) (2009=4,085,672)
Inventory (2010=1,047,150) (2009=940,421)
Cash(2010=16,619) (2009=18,931)
QUESTION # 02
In this question you have to make cross company analysis for both the companies calculate following ratios for both companies
Current Ratio= current assets / Current liabilities
Quick (acid test) ratio = current assets – inventory / Current liabilities
Cash ratio= Cash /Current liabilities
Use above data for Crestex and following is the data for KTM
From the data extracted from Balance sheet in annual reports of KTM:
Current liabilities are (2010=8,169,138 ) (2009=6,672,527)
Current Assets are (2010=5,903,185) (2009=4,530,22)
Inventory is (2010=2,393,113) (2009=1,779,826)
Cash (2010=78,851) (2009=80,297)
After calculating the ratios show which company is in better condition by showing current financial position