Reply With Quote
Dear you have to upload the assignment below this. So someone is able to solve this assignment.


hey guys... i am so struck,, i dont get any idea how to solve this assignment. please share idea solution if you people have anyView more random threads:
- need monthly subscription for a site as an advertiser...
- CS502 assignment # 2-Help needed
- Need help with admission dates
- operating assinment solution help
- helpppppppppppp meeeeeee plzzzzzz :(
- How to write the background of research May 2011
- SEo urdu traning in pakistan 2011
- MTH401 Assignment, Question no2 solution
- I want GDB 201 solution imidiately!
- Now make request and 100% garnette fresh paper of vu final...
Assignment No. 01 Marks: 20
Objectives of the Assignment:
If a student completes this assignment with full understanding of ratio analysis, he/she would be able:
To read and extract the required information from the financial statements.
To calculate, compare and interpret the results of the ratios.
To apply the concepts effectively in the upcoming courses of Finance.
To prepare well for the courses of internship or final project of Finance.
RATIO ANALYSIS
The Crescent Textile Mills Ltd. (Crestex) is one of the leading public limited companies incorporated
under the Companies Ordinance 1984. Its shares are quoted on all the Stock Exchanges in Pakistan. The
Crestex is engaged in business of textile manufacturing comprising of made ups, processed fabric, greige
fabric and yarn made from raw cotton and synthetic fiber(s). Crestex also operates a cold storage and a
power generation house. The financial statements of the company reveal that it is one of the financially
viable companies of the textile industry in Pakistan.
Q1. Using the audited financial statements with accompanying information for the year ended
June 30, 2010 provided in the Annual Report 2010 of The Crescent Textile Mills, you are
required to conduct Time-series Analysis of solvency measures of the company by
computing and interpreting the results of the following ratios for the years 2009 & 2010:
�� Total Debt Ratio
�� Debt-Equity Ratio
�� Times Interest Earned (TIE) Ratio
Note:
Time series Analysis refers to the analysis of ratios of the same company for different time
periods. Interpretations carry reasonable marks so they should not only be based upon
individual figures but also on the comparison of the ratios for both years.
Similarly, Kohinoor Textile Mills Ltd. (KTML) is one of the leading companies in the same business
sector and having close competition with Crestex.
Q2. Using the audited financial statements with accompanying information for the year ended
June 30, 2010 provided in the Annual Reports 2010 of The Crescent Textile Mills and Kohinoor
Textile Mills, you are required to conduct Cross company Analysis of liquidity measures of
the companies by computing and interpreting the results of the following ratios for Crestex &
KTML for the year 2010 only:
�� Current Ratio
�� Quick Ratio (Acid-test Ratio)
�� Cash Ratio
Note:
Cross company analysis refers to the comparison of the ratios of two or more companies within
same business sector (industry) for the same period. Interpretations carry reasonable marks so
they should not only be based upon individual figures but also on the comparison of the ratios
for both companies.
It is important to note that annual reports for the year 2010 should be used for analysis. The annual
reports are available on the following companies websites:
Crescent Textile Mills: Crescent Textile Mills Limited
Kohinoor Textile Mills: www. kmlg . com
The annual reports must be downloaded from the companies websites only. Annual reports downloaded
from any other source would not be acceptable.
Points to Remember:
The financial statements in the annual report 2010 not only contain the data for the year 2010 but
also for the year 2009.
The term Total Debt refers to the total liabilities of the company.
Interest expense includes mark up on short-term and long-term borrowings which can be found in
the details of Finance Cost under Notes to the Financial Statements e.g. Note # 32 in the annual
report 2010 of Crescent Textile Mills.
Inventory is mentioned as Stock-in-trade in the balance sheet.
Important Tips
Sponsored Links


Dear you have to upload the assignment below this. So someone is able to solve this assignment.
Urgent call: 03455242488. | Virtual University Assignments
Virtual University GDBs | Virtual University Papers | Vu Projects | Vu Handouts
About Expert
zara in do ankhon ko zehmat den aur gaur karien k upper issi thread k apko yehe asignment file nazar ajye gi
MARYAM KHOKHAR ----
LOLZ
yah tu kisi nay app ki post edit ki howi hai. mujay tu yah hi nazar aya hai ankhen khul kar aur band ker kay bhi .
03009520262
Rabeel Website

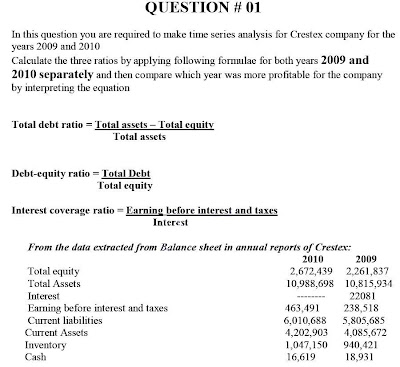
UESTION # 01
In this question you are required to make time series analysis for Crestex company for the years 2009 and 2010
Calculate the three ratios by applying following formulae for both years 2009 and 2010 separately and then compare which year was more profitable for the company by interpreting the equation
Total debt ratio = Total assets – Total equity / Total assets
Debt-equity ratio = Total Debt / Total equity
Interest coverage ratio = Earning before interest and taxes / Interest
From the data extracted from Balance sheet in annual reports of Crestex:
Total equity is (2010=2,672,439) (2009=2,261,837)
Total Assets are (2010=10,988,698 ) (2009=10,815,934)
Interest is (2010= ----) (2009= 22081)
Earning before interest and taxes (2010=463,491) (2009=238,518 )
Current liabilities (2010=6,010,688 ) (2009=5,805,685)
Current Assets (2010=4,202,903) (2009=4,085,672)
Inventory (2010=1,047,150) (2009=940,421)
Cash(2010=16,619) (2009=18,931)
QUESTION # 02
In this question you have to make cross company analysis for both the companies calculate following ratios for both companies
Current Ratio= current assets / Current liabilities
Quick (acid test) ratio = current assets – inventory / Current liabilities
Cash ratio= Cash /Current liabilities
Use above data for Crestex and following is the data for KTM
From the data extracted from Balance sheet in annual reports of KTM:
Current liabilities are (2010=8,169,138 ) (2009=6,672,527)
Current Assets are (2010=5,903,185) (2009=4,530,22)
Inventory is (2010=2,393,113) (2009=1,779,826)
Cash (2010=78,851) (2009=80,297)
After calculating the ratios show which company is in better condition by showing current financial position
chalen ah gia hai solution. ab khus han sab?
03009520262
Rabeel Website
Q 1:
“Time-series Analysis” of solvency measures
a) Crescent Textile Mills
Total Debt Ratio = (Total Assets – Total Equity)/ Total Asset
Debt-Equity Ratio = Total Debt / Total Equity
Times Interest Earned (TIE) Ratio = Earnings before Interest & Taxes/Interest
b) Kohinoor Textile Mills
Total Debt Ratio = (Total Assets – Total Equity)/ Total Asset
Debt-Equity Ratio = Total Debt / Total Equity
Times Interest Earned (TIE) Ratio = Earnings before Interest & Taxes/Interest
Q 2:
“Cross company Analysis” of liquidity measures
a) Crescent Textile Mills
Current Ratio = Current Assets/Current Liabilities
Quick Ratio (Acid-test Ratio) = (Current Assets – Inventory)/Current Liabilities
Cash Ratio = Cash/Current Liabilities
b) Kohinoor Textile Mills
Current Ratio = Current Assets/Current Liabilities
Quick Ratio (Acid-test Ratio) = (Current Assets – Inventory)/Current Liabilities
Cash Ratio = Cash/Current Liabilities
Well done ab sab khush hon gay
03009520262
Rabeel Website
ok fine it now and happy
acc501 assignment no 1 fall 2011
03009520262
Rabeel Website
There are currently 1 users browsing this thread. (0 members and 1 guests)
 Posting Permissions